Curves can have somewhat complicated mathematical formulas - exponential functions, for example. Lines - not so much. They're easy:
y = mx + b
where m represents the slope of the line and b the y-intercept, the point where the line crosses the y-axis.
What if you could turn an exponential curve into a line, though? Study the example below and complete the two additional examples on your own.
In Example #1 the graph of the raw (X,Y) data appears to show an exponential growth pattern. The line clearly does not fit the data. Select to graph the transformed (X, ln(Y) data instead of the raw (X,Y) data and note that the line now fits the data. You can easily find its equation:
Pick two points on the line - (2,4.6) (4,9.2),
for example - and determine its slope:
slope = (y2 - y1 )/(x2 - x1 ) = (9.2-4.6)/(4-2) = 4.6/2 = 2.3
Note that the y-intercept = 0. So the line has equation:
ln(y) = 2.3x + 0
To put the equation in the form y = ... you need to undo the ln(x) operation. To do this use its inverse, ex, on both sides of the equation:
eln(Y) = e(2.3x +0)
On the left side of the equation the inverse operations undo each other. And on the right side remember that e(a+b) = ea*eb. You are left with:
y = e2.3x* e0 or y= 1*e2.3x
You now have an equation of the (X,Y) relation. Enter your equation below in the form y = a*ebx where a=1 and b=2.3 and see how well it fits the original data.
y = * e x
Enter numeric values for a and b
and Graph
1) Example #2 is also a near perfect exponential relation. Try the approach outlined above to find its equation.
2) Example #3 is the data showing US population growth from from 1650 to 1810 in years since 1650. Determine the equation of this relation. How well does it agree with the equation provided in the Graphing Exponential Change model in the previous lesson? The methods used to derive the equations are different, but you should be close.
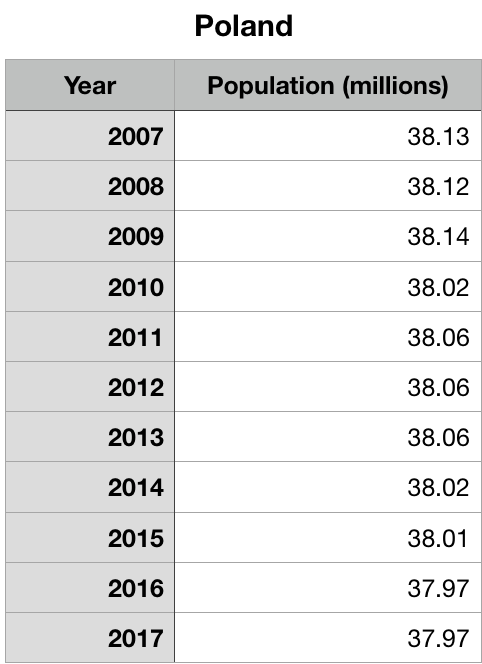
3) Population and exponential change can be negative as well as positive. Graph the data showing Poland's population over the last decade using a graphing calculator or an online app (Desmos, for example). Derive an exponential equation that models the change. (Reminder: The numbers are easier to deal with if you graph years since 2007 instead of the actual year.) Assuming the same change in Poland's population continues, what does your equation predict that the population will be in 2030? 2050?
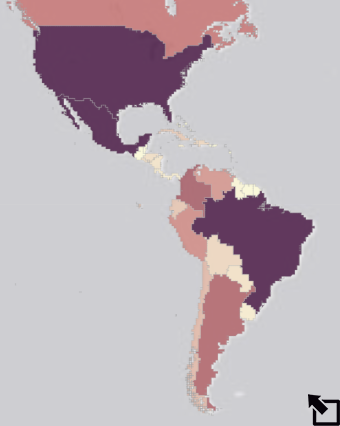
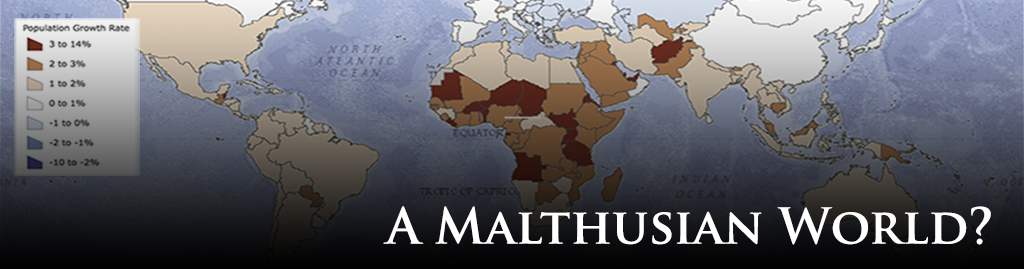
4) Back to
Malthus. Open the Malthusian
World? map. You can access the data available
for each layer using the table ( ![]() ) icon. Select one of the countries of the Americas in the
population layer and two of its staple foods. Develop equations
modeling your country's population growth and the change in the
production of the staple foods you selected. Discuss to what
extent Malthus was right about the nature of the change in
population relative to food production in the country you
selected.
) icon. Select one of the countries of the Americas in the
population layer and two of its staple foods. Develop equations
modeling your country's population growth and the change in the
production of the staple foods you selected. Discuss to what
extent Malthus was right about the nature of the change in
population relative to food production in the country you
selected.