Evolving Patterns of Vegetation & Land Use

Change happens. Forestry and land use practices in El Dorado County have resulted in considerable change in the ecology of the county over the last century and a half. So too have climate changes in the region.

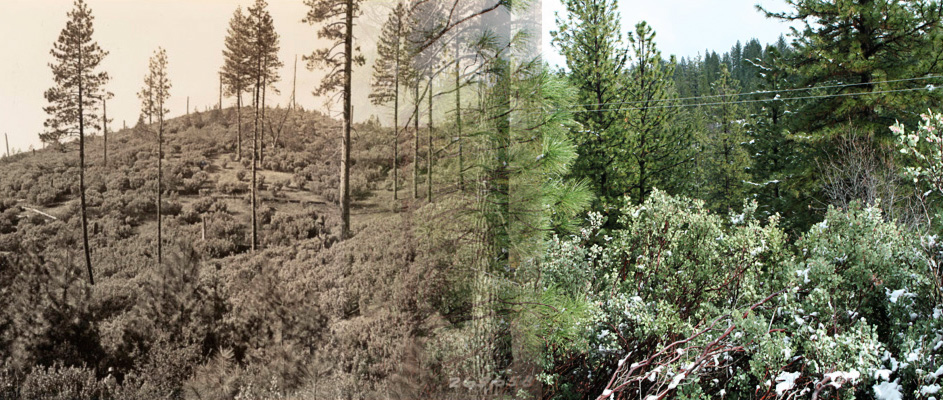
Ecologists at the University of California at Davis are studying changes in vegetative patterns in the Sierra Nevada foothills and mountains using data going back to the Wieslander studies of the 1930s and similar inventories from the last few decades.1 They have noticed a number of changes in the area's vegetation both in type and extent - changes that you will be able to examine in the following activities. You can preview the general pattern of change in the two most predominate types of vegetation in the county - Ponderosa pine and woodland oaks - in this set of slides. As you examine the slides, see what general changes in the locations of these two types of vegetation you notice.
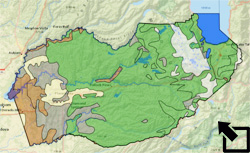
Let's look more closely. Load the El Dorado GIS file and check to see that the following layers are active:

  • El Dorado County
    • County Boundary
    • Vegetation
      • 2002
      • 1977
      • 1945
      • 1934
  • World Street Map

Make sure that all other layers are inactive and use the bookmark to zoom in on El Dorado County.

Click open each vegetation layer in succession starting with 1934 and ending in 2002. You will be able to see the overall change in the county's vegetation over this time period. Notice that the map legend for 1934 layer is somewhat different from the other three.

The UC Davis ecologists claim that there has been a shift in vegetation pattern up the slope of the Sierras and to the east. Let's focus on one of the vegetation types, the Conifer Forest (including such species as Ponderosa Pine and Douglas Fir) and check the accuracy of this general observation in El Dorado County. Describe the general locations of the Conifer Forest in this vicinity from 1934 to 2002.

My World GIS
ArcGIS

• Select the El Dorado County Vegetation - 2002 layer in the table of contents. Notice that the Conifer Forest has Grid Code 8.

• Click on the Analyze button (Analyze ) and select to analyze By Value. Complete the form as indicated below making sure that you select to make your selection a new layer:

Select by Value

• Click OK.

• Turn off the El Dorado County Vegetation - 2002 layer.


• Right click on the Vegetation 2002 layer in the table of contents and select Properties.

• Click on the Define Query Tab...

• Double click on Grid Code, click on ( Equal Sign ), and type 8 to create the selection pictured below:

Query

• Click OK.

• Click OK again to leave the Properties window.


The Davis ecologists also claim that there is a difference in the extent of the area occupied by different species today as opposed to in earlier years. Select regions in the 2002 map that are Conifer Forest. What is their total area?

My World GIS
ArcGIS

• Select the new Conifer Forest - 2002 layer.

• Click on the Statistics button ( Statistics).

The Sum of the acres in Conifer Forest is shown in the Statistics window.

• Make sure that you are working with Conifer Forest data (Grid Code 8). See the GIS Help above if necessary.

• Right click the Vegetation 2002 layer and select Open Attribute Table.

• Right click on the Acres field and select Statistics.

• The Sum of the acres in Conifer Forest is shown in the Statistics window.


Use the tools discussed above and continue your investigation in the Evolving Patterns worksheet.

images blended from the Image #26566, Wieslander Vegetation Type Mapping Collection courtesy of the Marian Koshland Bioscience and Natural Resources Library, University of California, Berkeley and a 2010 image from the same location taken by the author.

1James Thorne, et. al., “Vegetation Change Over Sixty Years in the Central Sierra Nevada, California, USA,” Madrono, Vol. 55, No. 3, pp. 223-237, 2008.

Last modified in January, 2011 by Rick Thomas