|
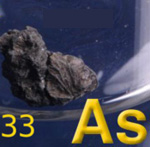
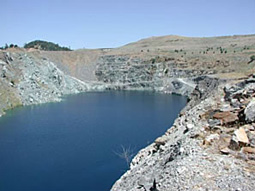
In the historic gold-rush country of Northern California, Lovetta Pyle has struck a vein of woe. Shortly after moving to the town of Sutter Creek, she learned that the gray "sand" that whole neighborhoods sit on is actually mine tailings, the grit left over after gold has been extracted from the ground. In those tailings is a toxic byproduct of the mining process: arsenic, in concentrations up to 50 times higher than the level deemed safe by the government.
Now Pyle finds that her house is virtually worthless; no one will buy it, and no bank will write a mortgage. "I feel trapped and stifled," says Pyle, 48, who was forced by a chronic heart ailment to take early retirement as Sutter Creek's postmaster. "You think, 'Oh, God, what if this house is killing me?' "1
|
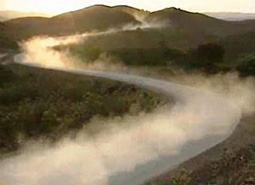
Arsenic from mine tailings can become dangerous as it has in Sutter Creek in a variety of ways. It can become airborne as a result of:
• wind
• being spun up by ATVs and other vehicles driving on the tailings themselves or on dirt roadbeds where mine tailings have been used for gravel
• children's play in developments where tailings have been used for fill
Arsenic is also freed from naturally occurring mineral sources like pyrite through interaction with sulfuric acid that is often present in water pooled in mine shafts and in tailing ponds at deserted mine sites. In this form it can be leached into groundwater, although its concentration is reduced as it moves away from its source.

Roll mouse over map to hide known gold mine sites
Click to open map
|
The map at the right shows the locations of known California mines overlayed on a map of average arsenic levels in the state's counties. Keep in mind as you read the map that the arsenic levels are averaged across large areas. Therefore, you cannot draw conclusions about specific locations - cities or towns, for example. Consider, also, that the U.S. Environmental Protection Agency safe drinking water standard for arsenic is 10 parts per billion or less.2
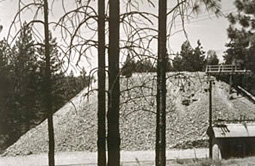
1) Mine tailing sites are common throughout the Mother Lode. As a result, runoff from old mine shafts and from tailing ponds are considered potential sources of arsenic groundwater contamination. Open the El Dorado: Mining map and turn on the Arsenic layer. Complete a table showing the average arsenic levels in the nine Mother Lode counties:
| County |
Arsenic Level |
County |
Arsenic Level |
Yuba
|
|
Amador |
|
| Sierra |
|
Calaveras |
|
| Nevada |
|
Tuolomne |
|
| Placer |
|
Mariposa |
|
| El Dorado |
|
|
|
2) Do the arsenic levels in the Mother Lode counties seem different from those in other counties around the state? Explain.
3) Describe any geographic pattern you see to the arsenic levels within the Mother Lode.
4) Rolling your mouse over the map above hides/displays a layer of known gold mine sites in California. Describe the relation between mine sites and the levels of arsenic in counties around the state.
Is there a relationship between ground water levels of arsenic in California and the rate at which cancer occurs? Epidemiologists ask this kind of question all the time searching for risk factors for all sorts of medical conditions. You will need to prepare two maps that you can examine side-by-side to begin to address this question:
- • a copy of the map of California you have been using showing the average county Arsenic levels
- • a map showing the Cancer Rate/100,000 population by county
5) Is the correlation between ground water levels of arsenic in California and cancer incidence rates positive or negative? That is, are higher levels of arsenic generally associated with higher rates of cancer (positive) or lower rates (negative)?
6) How strong is the correlation? Is there a distinct pattern (strong) or does the relationship appear random (weak) or somewhere in between?
7) The County layer in the El Dorado GIS file contains fields for the death rates per 100,000 population for all Cancer and for Lung, Bladder, and Skin cancers for each of the California counties. As you can see there is a moderate degree of correlation between rates of cancer and arsenic levels in California counties. However, is the relationship stronger for some types of cancer than others? Prepare a comparison using the data available for lung, bladder and skin cancers. As you study the results keep the following national and state averages in mind:
Average Annual Cancer Incidence Rates/100,000 Population 2005-2009
| |
All Cancers |
Lung |
Bladder |
Skin |
| United States |
465.0 |
67.2 |
21.1 |
20.7 |
| California |
438.0 |
57.4 |
19.0 |
19.2 |
You may also want to refer to the intensity of mining activity as reflected in the map above.
Write a short summary discussing your conclusions.