|
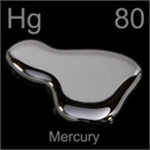
We have mentioned that quicksilver [mercury] is put into sluices to detain the gold. The minute particles of gold form an amalgam with the mercury. The quicksilver, therefore, must be exposed to the gold as much as possible. With this intent, at first only a small amount of washing is done through the sluices, that the spaces between the stones, or blocks, of the pavement, may become partially filled with earth.
The quicksilver is then introduced. It is scattered in a light spray all along the sluice. The first charge of quicksilver is between five and six hundred pounds for five thousand feet of sluice. After that the daily charge, applied twice a day, is about one hundred pounds. Much of the quicksilver is regained when separated from the gold....
The quicksilver is then separated from the gold. A quicksilver bath divides the gold from any base metal which may have combined with it. The free mercury may then be obtained by straining through a filter of canvas. After this the amalgam is washed in a bath of water and sulphuric acid, when the mercury is considered pure. The gold and remaining quicksilver is now placed in a retort. The mercury is vaporized by heat, and after passing through a tube, is condensed in water. The pure gold is then removed.1
|
This description of the use of mercury in the capture of gold presents the first step in a complex web of potentially poisonous environmental events. The activity in the Mercury page allows you to link together the pieces pictured below in a concept map in order to better understand the effects across time and place of this toxic substance.
Let's Go Fishing -
But wait. Even an innocent activity like fishing may be a problem in California's gold country. The incidence of mercury contamination in many of the area's streams, lakes, and reservoirs and the resulting bioaccumulation and biomagnification of mercury in fish should at least give you pause - something to check out.
A friend has recommended Indian Creek Reservoir a few miles north of Shingle Springs. Open the El Dorado: Mining map and use the bookmark to zoom in on Indian Creek Reservoir. Check to see that these layers are on:
-
- El Dorado County Major Rivers & Lakes
- El Dorado County Rivers & Streams
If mercury is a potential problem you'll need to check to see if any of the streams that feed the reservoir drain old and potentially contaminated mining sites:
| • |
Determine the extent of the lake's watershed by following any streams entering the lake back to their source. |
| • |
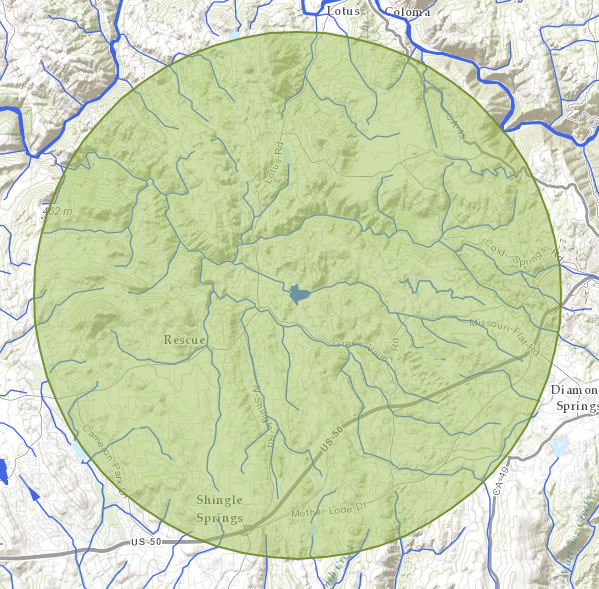
Click MODIFY MAP and Add map notes. |
| • |
Select the circle tool and draw a circular buffer around the lake (like the one pictured above) with center at the lake and extending to the extreme edge of the lake's watershed. |